 |
 |
 |
 |
 |
 |
 |
 |
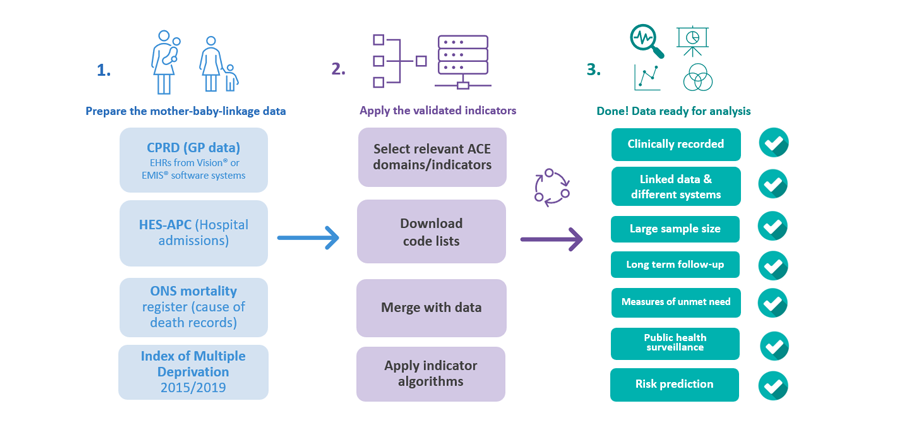
This page provides a guide to get you started incorporating validated indicators to identify ACEs in EHRs.
How does it work?
To use the ACE indicators, you will need:
- Access to an EHR data source for research: Obtain authorised and de-identified data of children and parents for research purposes. Most ACEs are captured in primary care. Several data sources in the UK provide linked primary care data of children and parents, including the Clinical Practice Research Datalink (CPRD),The Health Improvement Network (THIN), QResearch. Access to CPRD requires protocol approval via CPRD’s Research Data Governance Process. Please visit the Health Data Research Innovation Gateway for more information on available data sources.
- OR: Access to your organisation’s locally stored EHR data: Obtain authorised access to your service’s/NHS trust’s locally stored EHRs of children and parents for service-related and research purposes. Many NHS trusts provide streamlined processes to access data sources like the Clinical Record Interactive Search (1,2,3). These local data sources often have a data structure consistent with national data sources like HES-APC, and used to measure ACE indicators. Contact your local data department to seek further advise on how to access these resources.
- Secure Data Environment: Ensure that your work is conducted within a secure data environment (SDE) approved for working with EHRs. SDEs provide the necessary technical and governance safeguards to protect patient data and meet data security standards. Your local NHS trust, data providers, or research institutions may have existing SDEs in place.
- Data linkage of child and parent data: Implement robust data linkage of child and parent EHRs. Providers like CPRD allow you to access already established linkages of mother-child data. For linkage of mother-child data in other EHR databases, please see methods described elsewhere 1,2,3. For paternal linkage, please see methods described here.
- ACE Indicators: You are in the right place. Most indicators are derived using algorithms that identify and extract information from EHRs using clinically coded healthcare information (for example, ICD-10, Read codes, SNOMED-CT). We describe the ACEs and how to apply the algorithms below. Once you’re ready, please head over to the download section, where we provide a comprehensive list of validated ACE indicators based on established research and definitions.
- Data preparation and standardisation: Extract the necessary data elements from the EHRs related to ACE indicators and relevant health outcomes. Prepare the data by cleaning and structuring it in a format ready for merging with the appropriate ACEs code list.
- Apply algorithms for ACE indicators: Apply appropriate ACE algorithms using R, Python or any data management language to ensure you obtain validated indicators in the linked child and parent data.
IMPORTANT! Implementing the ACE indicators in more complex data sets like primary care data (GP records) requires restructuring, manipulating and combining multiple large data sets into one or multiple new files using a programming language of choice (e.g., Python, R). This section provides only brief information on data management specific to the implementation of the ACE indicators. Many data management tasks involve a split-apply-combine strategy, that is, the ability to “..break up a big problem into manageable pieces, operate on each piece independently and then put all the pieces back together (Wickham, 2014, p1)”. This information is therefore intended as supplementary recommendations to users who already have skills in programming languages like R, Python, or SQL. To learn how to use R for data management, we recommend reading “R for Data Science (2e)” by Hadley Wickham, Mine Çetinkaya-Rundel and Garrett Grolemund, freely available online.
ACE indicators
Domains and indicators
We developed two measures of ACEs for electronic health records (EHRs):
- Domains (ie, grouped indicators) and;
- Indicators (ie, grouped codes or measures)
- Indicator 2
- Indicator 1
- Most specific indicator
- Code (alphanumerical code attached to an event description)
- Most specific indicator
- Indicator 1
- Indicator 2
Indicators represent a variable of grouped codes or measures for a potential recorded ACE in mothers, fathers or children. The ACEs follow a hierarchical structure, with three levels of specificity of the underlying ACE construct. The structure ranges from the most specific ACE category (specific indicator) to broader categories (indicators 1 and 2), to the six overall ACE domains consistent with the original ACE study.
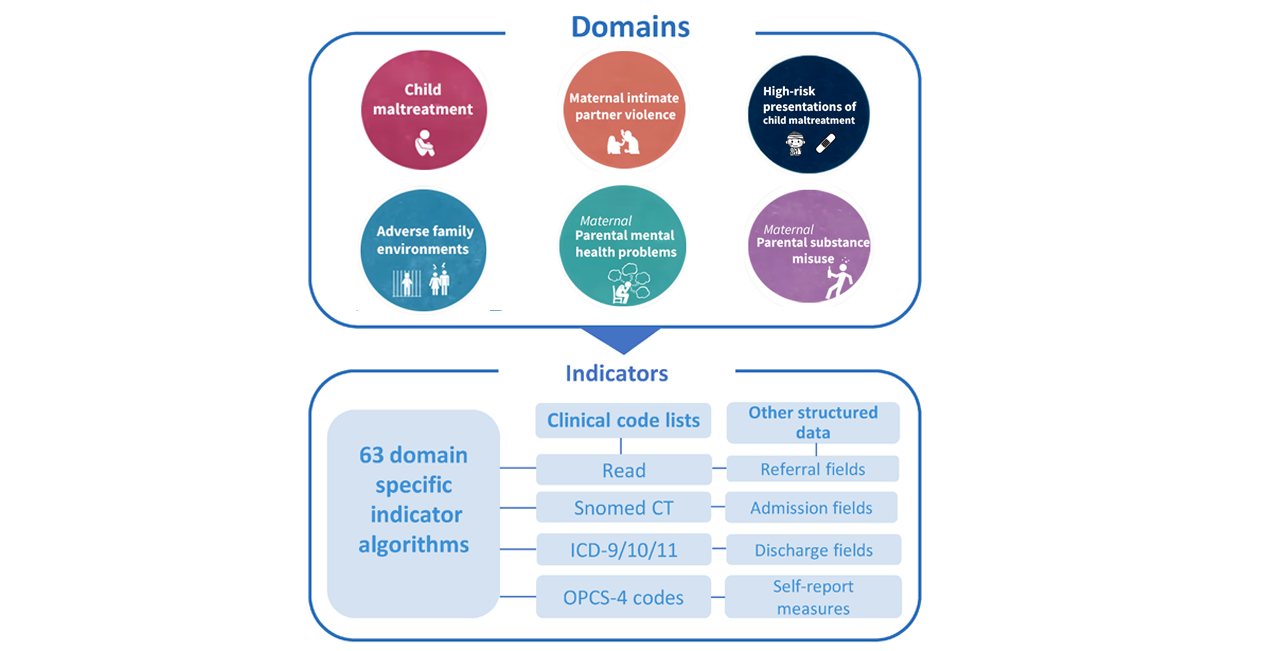
Note: The ability to use specific indicators depends on your sample size. We recommend restricting the disaggregation of specific indicators to those present in 250 or more unique children. For many studies, it will be most appropriate to use the six ACE domains only and avoid disaggregation into specific indicators unless required to answer your research question.
Think-family approach: Unless specified, indicators refer to information recorded in the child’s, the mother’s and the father’s records. Properly studying ACEs requires a “think-family” approach - we need both children’s and parents’ data! Think-family means we recognise that the health and well-being of children are intricately tied to their parents’ experiences and health outcomes.

Code lists
The ACE indicators are mapped onto codes stored in code lists. Each data source will have different coding systems. The current ACEs indicators include ICD-9/10 codes (hospital/death records), Read codes, SNOMED-CT codes, medcodes, prodcodes, gemscripts (general practice), and codes for obtaining continuous data or coded information from speciality fields in CPRD GOLD, HES-APC, HES-A&E and HES-OP.
We have converted several original codes so the code lists contain one column of research-ready codes. This ensures efficient information integration from multiple coding systems without accidental deduplication. See code list dictionary and conversion table below for more information.
Code list dictionary
| Provided variable | Description |
|---|---|
| Code | Data ready code. Contains CPRD GOLD medcodes and prodcodes (as used in the data provided by CPRD with added prefixes to prodcode), ICD-9/10 (removed punctuations for ICD), and OPSC-4 codes. Prefixes d_ added to prodcodes and p_ to OPSC-4 codes. Prefixes prevents de-duplication as different systems may use the same code for different descriptions. |
| Code original | Original code as entered into respective system (removed punctuations for ICD) |
| Coding term | Original code description |
| Indicator code | Indicator code name |
| Indicator specific | Most specific indicator |
| Indicator 1 | Main ACE indicator combining multiple codes or measures as used in validation paper |
| Indicator 2 | Broader ACE indicator combining multiple codes or measures |
| Domain | ACE domain grouping all indicators together (applicable for the overall code list) |
| Severity | Where applicable, this variable indicates the severity classification of the code description. e.g. For alcohol misuse, mild, moderate, severe. |
| Scale | 1=Indicates that the code and severity classifications are dependent on extra clinical information (e.g. frequency of alcohol consumption). By default, this is set to Mild for alcohol. See rule-based algorithms. |
| Reference | 1=code is part of family violence reference standard, 2=code can be used as a broader measure of family violence |
| Individual | 1=code applies to child only, 2=code applies to mother only, 3=code applies to mother or child (i.e. either), 4=code only applicable to female children |
| Coding systems | GP/primary care: Read, OXMIS, Prodcode (prescriptions or items), CPRD REFERRAL FHSASPEC (field specific), CPRD REFERRAL NHSSPEC (field specific). HES-APC/secondary care/ONS: ICD-10, OPCS-4, ICD-9 (applies to ONS < year 2000), HES-APC DISDEST OR ADMISORC (field specific) |
Example ACE indicator in the code list
| Code | Coding term | Indicator 1 | Indicator 2 | domain | severity | scale | reference | individual | coding system |
|---|---|---|---|---|---|---|---|---|---|
| 912 | [D]Anorexia Anorexia | Anorexia | Eating disorders | Parental mental health problem | diagnostic | 2 | Read |
Data preparation and standardisation
Now, let’s get the data ready for analysis! Unlike data sets such as the Hospital Episode Statistics where everything is nicely placed into a few files, EHRs from primary care are messier and located in multiple separate files with different structures and formats. Therefore, implementing the ACE indicators using code lists requires preparing and restructuring your data sets into a uniform format. The data standardisation allows you to directly merge code lists and indicators to the data set to apply their attached algorithms.
Data preparation steps:
- Extract the raw data files using SQL (or other programming)
- Restructure each data file (ie. creating new data files with consistent format)
- Data clean & standardise each file (ie, add prefixes to codes, remove waste etc)
- Retrieve data from standardised files & bind into a “master ACE data file”
- Merge ACEs code list with the master file
- Apply algorithms & retain your ACE indicator (final variable)
- Merge the ACE indicator onto your selected cohort for analysis
- Apply algorithms & retain your ACE indicator (final variable)
- Merge ACEs code list with the master file
- Retrieve data from standardised files & bind into a “master ACE data file”
- Data clean & standardise each file (ie, add prefixes to codes, remove waste etc)
To learn how to use R of Python for data management related to EHR research, we recommend reading “R for Data Science (2e)” by Hadley Wickham, Mine Çetinkaya-Rundel and Garrett Grolemund, freely available online.
Data restructuring
Restructuring the data
- Restructuring data files and fields. Having extracted your raw files, we need to restructure all files and data fields (variables) into a consistent “long format”, and rename variable into consistent names. The consistent structure ensures we can easily bind all files into one combined file later. For example, the ONS mortality and HES-APC databases are provided by CPRD in wide format and needs restructuring.
- Drop any irrelevant data fields/variables to reduce file size. e.g. In the CPRD clinical file, the variables “constype, sysdate, data8” can easily be omitted, as they are rarely used for the ACEs.
- Make sure to add an extra variable to each data file to label the original data source (HES, CPRD clinical) before saving it.
Data cleaning and standardisation
Most large EHR files contain various types of errors, such as missing values, inconsistent formats, or invalid entries. Data cleaning ensures consistency across different variables and datasets.
- Clean and remove any punctuations, white spaces or trailing alphanumeric from data fields with relevant codes
aces_data$medcode <- gsub("\\s+","",aces_data$medcode) #removes white/blank spaces
aces_data$medcode <- gsub("\\.","",aces_data$medcode) #removes punctuations
- For each file, convert all data fields into the same classes (e.g. character, date) and machine-readable format (e.g., R and Python likes dates as: year-month-day)
# R dplyr example of converting a data frame to character class
# and restructuring a date variable provided in the incorrect format

aces_data <- aces_data %>% mutate_all(as.character) %>%
 separate(date_example_variable,c("day","month","year"),sep="-",remove=T) %>%
 unite(new_date_variable,c("year","month","day"),sep="-",remove=T)
Conversation table of codes requiring prefixes
- A substantial proportion of codes from the different coding systems share the same alphanumeric code as others. For example, prodcodes (i.e. medications/prescriptions), medcodes (i.e. diagnoses/symptoms) and ICD-9 codes (old hospital coding) share thousands of the same alphanumeric codes, but they mean different things with unique event descriptions.
For example: "11246 (prodcode) - Lofexidine 200 microgram tablets" vs. 11246 (medcode) – At risk violence in the home- To preserve each code’s uniqueness, we have converted the relevant codes into new unique codes by adding prefixes to relevant code lists, which affect most coding systems. We list the prefixes below and their affected data files, as you will need to convert the codes in each data file to match the converted code lists.
- In R or Python, we recommend using the “dplyr::unite” function or “R::paste0()”. In Stata, you can use the “Concatenation” function (see Stata documentation).
| Data source & Coding system | Prefix added | example |
|---|---|---|
| CPRD GOLD: Prodcode (Gemscript product code) | d_ | d_727 - Sertraline 100mg tablets |
| ONS Mortality data collected ≤2000 & HES-APC ≤1998: ICD-9 | e_ | e_5713 - Alcoholic liver damage unspecified |
| HES-APC: OPCS-4 | p_ | p_X66 - Cognitive behavioural therapy |
| HES-A&E: A&E specific diagnosis system | aed_ | aed_144 - Poisoning (inc overdose) - other, inc alcohol |
| HES-A&E: A&E speciality field “treatment” | aet_ | aet_54 - Social worker intervention |
| HES-A&E: A&E speciality field “investigations” | aei_ | aei_21 - Pregnancy test |
| HES-OP: OP speciality field “treatment” | opt_ | opt_711 - child and Adolescent Psychiatry Service |
Create ACE specific “master file”
- Having identified your cohort and restructured the multiple separate files, the next step is to extract the relevant data from each file and bind this into a new one combined “master file” with only ACE data.
-
Streaming data extraction. To extract only relevant patient ACE data, we recommend you apply a streaming approach to the new standardise files by iterating over (i.e. repeating the matching) each patient ID in each file against your separate list of patient IDs (i.e. cohort) and your separare ACEs code lists.
-
A “streaming approach” refers to reading and processing data in chunks or sequentially rather than loading the entire dataset into memory at once. Whilst SQL is useful for handling larger databases, R or Python can also apply streaming by first loading your list of relevant patient IDs and then extracting relevant data using package functions like: data.table::fread(…. ,data.table=F) with dplyr::filter and fastmatch::%fin%.
- In the final step, we recommend (depending on research purposes) binding all retrieved ACE files into one combined “master database” with only relevant ACE data, which should now follow a consistent unified format for easier retrieval. The above steps can be incoperated into one step. Here is an example in R which extract relevant patient data from multiple files (assuming they have the same underlying file structure) into one new file without loading everything into working memory:
# Step 1: Set up the working directory
setwd("path/to/ehr/files")
# Step 2: Install and load required packages
install.packages(c("data.table", "readr","tidyverse","fastmatch"))
library(data.table)
library(readr)
library(tidyverse)
library(fastmatch)
# Step 3: Read the patient ID list and code list
patient_id_list <- read_csv("patient_id_list.csv")  # Adjust the file name and format as per your data
# Step 4: Stream through EHR files, match with patient ID, and save relevant data to new files
for (ehr_file in list.files(pattern = "*.txt")) {  # Adjust the pattern as per your file extension
  output_file <- paste0("output_", ehr_file)  # Generate output file name

  # Create output file and write column names
  fwrite(data.frame(), output_file)  # Creates an empty file
  fwrite(names(data.table::fread(ehr_file, nrows = 0, header = TRUE, data.table = FALSE)), output_file, append = TRUE)  # Write column names

  # Stream through EHR file and extract relevant data
  ehr_stream <- data.table::fread(ehr_file, header = TRUE, data.table = FALSE, header = T, data.table =F,colClasses="character",nThread=8)
    relevant_data <- ehr_stream %>% filter(patient_id %fin% patient_id_list$patient_id)
      # Append relevant data to output file
    fwrite(relevant_data, output_file, append = TRUE, quote = FALSE, row.names = FALSE,col.names=T)
}
Deriving variables
Introduction
- Most indicators are ready to be used after merging the correct code list with your prepared ACE data file. However, many indicators rely on rule-based algorithms to ensure coded measures meet appropriate cut-off criteria and prevent misclassifications. Algorithms include age-restrictions, exclusions of accidental injuries, genetic predispositions (bone diseases), traumatic birth injuries or maternal-child transmissions during birth (see below).
- For GP records, we define indicators by combining information recorded in Read codes, prescriptions, referral fields and validated self-report measures (continuous variables needing re-coding) routinely administered by GPs or nurses (e.g. alcohol use).
- For hospital and death registration records, we define indicators by combining codes from the International Classification of Diseases 9th/10th edition (ICD-9/10), the Classification of Interventions and Procedures (OPCS-4) and HES-APC discharge/admission fields.
Time restrictions: The validated ACE indicators are time sensitive and apply any time between 2 years before birth and 10 years after birth. However, most child maltreatment and high-risk presentations of child maltreatment are limited to 2 years before to 3, or 5 years after birth. Ascertaining the correct exposure time in relation to children’s birthdate is essential.
Applying algorithms using the code lists built-in helper functions
Here, we list steps to apply rule-based algorithms and obtain valid indicators:
- 1. Merge code lists. Merge the new combined “ACE specific data file” with your relevant code list. Note: In the above R script example, the code list is already automatically merged with the new combined “ACE specific data file”.
-
Keep only unique recordings. After merging the code lists, many recordings will be duplicated as the ACE codes are iterated over both children’s and parents IDs. In R or Python, we recommend removing duplicate recordings using
e.g. "aces_data %>% dplyr::distinct(patid,medcode,eventdate,system,source,individual,.keep_all=T) - 2. Filter/subset the data against 1-2 criteria The ACEs code lists were developed with built-in “helper variables”. After merging the code lists with your ACE-specific file, you should have extra variables to filter or subset values against and retain only data with valid indicators. We provide an example below using “if-then” assumptions to rows where the “Code” column value is present in the code list, and additional conditions are met.
mmhps_depres_anx <- merged_data %>% filter(Domain=="mMHPs" & scale=="1" & data1 > cut_off

#In this case we retained only mental health measures/scales that met validated cut-off critera
# In addition to selecting the specific domain, helper variables include:
#"Scale==1" (keep measures with continious data)
# data1 "cut_off" (keep only values in data1 above cut-off score)
- To apply multiple if-then assumptions against a standalone code list we rely on control flow methods. Here is a generic example using “dplyr:case_when:”
data <- data %>%
  mutate(Binary_Variable = case_when(
    Code %in% code_list & Field1 > 10 & Field2 == "Value" ~ 1,
    Code %in% code_list & Field1 <= 10 & Field2 != "Value" ~ 0,
    TRUE ~ NA
  ))
- 3. Applying multiple rule-based criteria. Some indicator requires creating new variables to apply multiple rules simultaneously.
- An example includes the algorithm for depression based on medication and non-diagnostic symptoms. Here, you will need to filter the data based on the presence of any of the coded depressive symptoms or medications and the co-occurrence of any diagnosis or intervention received within the past 2 years.
# Step 1: Load the required packages
library(dplyr)

# Step 2: Import the EHR data
ehr_data <- read.csv("ehr_data.csv")  # Replace "ehr_data.csv" with the actual file path and name

# Step 3: Define the criteria for depression
# Define the symptoms or medications associated with depression
depression_symptoms <- c("symptom1", "symptom2", "symptom3")
depression_medications <- c("medication1", "medication2", "medication3")

# Define the previous collection of codes within the past 2 years
previous_codes <- c("code1", "code2", "code3")

# Step 4: Apply the algorithm to identify depression cases
depression_cases <- ehr_data %>%
  filter(
    # Check if any of the depression symptoms or medications are present
    any_of(depression_symptoms) |
    any_of(depression_medications),

    # Check if any of the previous codes are present within the past 2 years
    any_of(previous_codes) & visit_date >= (Sys.Date() - 365 * 2)
  )

# Step 5: Explore the identified depression cases
summary(depression_cases)
- Finally, once you applied the algorithms, keep only one ACE indicator or domain per each unique child (e.g., using “dplyr’s “distinct()” function) within the relevant study period before merging it back to your cohort.
Download code lists
- ACEsinEHRs control documentation / release information Right-click on link to save as a “.txt” file (i.e. using option “save link as”) Total number of included ACE codes: 8802 (ACEs) + 8808 (covariates) Total number of excluded/tested codes: 7671
All ACE indicators:
- All ACEs (8864)
- All ACEs + crossmapped SNOMED CT (8864)
- All ACEs GP/CPRD only: medcodes, prodcodes, measures only (6618)
- All ACEs Hospital only: ICD, OPCS and HES-APC specific fields (2246)
By ACE domain:
- Child maltreatment (1312)
- Intimate partner violence (972 including 519 codes for assault algorithm)
- High-risk presentation of CM (801)
- Adverse family environment (977)
- Parental mental health problems (3711)
- Parental substance misuse (1091)
Covariates: non-ACEs used to add information to risk prediction models (8808)
Code lists for rule-based exclusions
- Accidents (2017)
- Osteoporosis - Bone disease (406)
- Birth injuries or traumatic complications (238)
- Mother-to-child-transmissions (15)
Need more code lists?
Visit:

Go back
Dr Shabeer Syed, Clinical Psychologist & Senior Research Associate